
Healthcare reimbursement practices are under scrutiny, and payment levels are declining for providers from emergency medical services (EMS)...

2020 NASEMSO Survey Reflects Evolution of EMS Industry

(7 min read) In 2011, the first comprehensive National EMS Assessment was completed, thanks to funding by the National Highway Safety Administration (NHTSA) and the leadership of the National Association of State EMS Officials (NASEMSO) and multiple other organizations. Recently NASEMSO released an updated 2020 version of the National EMS Assessment.

Having led the 2011 EMS Assessment data collection process, I’ll share through this blog a high-level summary of the changes that have occurred within EMS and our industry over the past 10 years. The original 2011 goal of the EMS Assessment was to describe EMS from a “System of Care” perspective. Data were collected (interestingly, using iPads) via an extensive survey and compiled from all 56 states, territories, and the District of Columbia. The 2020 EMS Assessment was administered in the same spirit, and 54 of the 56 geographies participated. Since both assessments were completed by survey, not every state and territory was able to complete every question. That being said, there are four main topic areas we can consider.
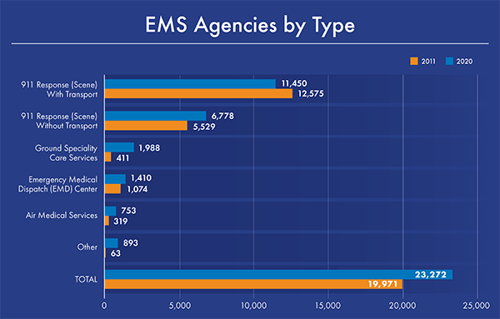
EMS Agencies are typically classified as closely as possible to the NEMSIS definition. The five main groups are: 911 Response to the Scene With Transport, 911 Response to the Scene Without Transport, Ground Specialty Transport Services, Air Medical Services, and Emergency Medical Dispatch (EMD) Centers.
Overall, the number of EMS Agencies grew from 19,971 in 2011 to 23,272 in 2020. This was an increase of 16.5% over the 10 years or 1.6% average annual growth.
General trends observed comparing the 2011 with the new 2020 EMS Assessment include:
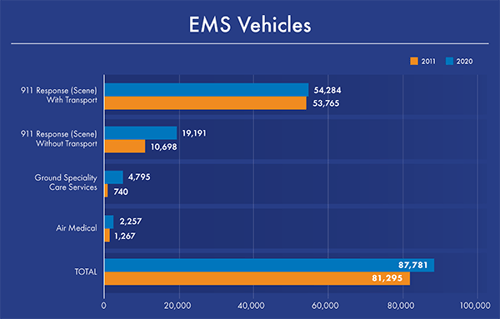
EMS Vehicle Types and Numbers are also mapped to the NEMSIS definition. The four main types are 911 Response to Scene With Transport, 911 Response to Scene Without Transport, Ground Specialty Care, and Air Medical.
Overall, the total number of EMS Vehicles increased from 81,295 in 2011 to 87,781 in 2020. This reflected 8.0% total growth, averaging 0.8% per year. More than 75% of all growth was attributable to Ground Specialty Care and Air Medical Services. This information is consistent with the increase in the number of Specialty Care Agencies which, as stated above, are focusing on a higher level of care and interfacility transports.
General trends that are noted comparing the 2011 with the new 2020 EMS Assessment include:
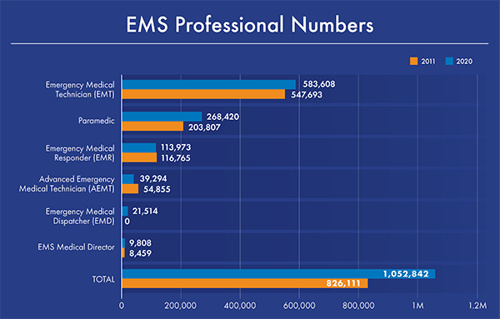
EMS Professionals and Medical Directors are more difficult to compare “apples to apples” between the 2011 and 2020 due to changes in EMS curriculum and definitions. For this analysis, The 2011 First Responder maps closely to the 2020 Emergency Medical Responder (EMS) level. The 2011 Emergency Medical Technician (EMT) was compared to the 2020 Emergency Medical Technician, although there are differences. The 2011 EMT Intermediate level provider compares to the 2020 Advanced EMT level provider.
Information on Emergency Medical Dispatch (EMD) level providers was not collected in 2011, therefore no comparisons can be made. EMD data from 2020, however, was included in the EMS Professional numbers. EMS Medical Director numbers are captured in the graph below, but not included in the overall EMS Professional total.
Overall, the total number of EMS Professionals increased from 826,111 in 2011 to 1,052,842 in 2020. This reflects a total growth of 27.5% or 2.8% average annual growth.
Noteworthy observations in comparing the 2011 with the new 2020 EMS Assessment include:
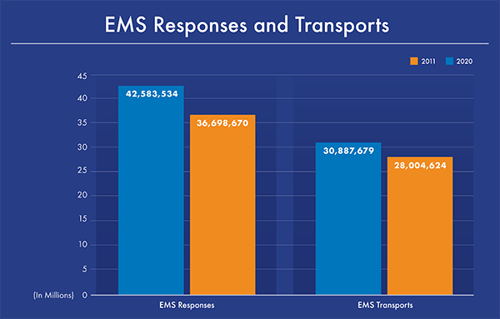
EMS Response and Transport Numbers are mapped to the NEMSIS definition.
Overall, the total number of EMS Responses increased from 36,698,670 in 2011 to 42,583,534 in 2020. This was a growth of 16.0% or an average annual growth of 1.6%.
The total number of EMS Transports increased from 28,004,624 in 2011 to 30,887,679 in 2020, showing total growth of 10.3% or 1.0% average annual growth.
In closing, although these data have been collected using a voluntary survey of State EMS Directors and represents EMS from a state regulatory perspective, it is descriptive of the EMS industry. There are some interesting trends which have occurred during the past 10 years:
Doing More With Less: How Dispatch Automation Benefits EMS Operations
How EMS Technology Integration Can Have Compounding Value for Agencies
Subscribe to our blog and receive quality content that makes your job as an EMS & fire, hospital, or AR professional easier.
Subscribe to our blog and receive quality content that makes your job as an EMS, fire, hospital, or AR professional easier.