
Healthcare reimbursement practices are under scrutiny, and payment levels are declining for providers from emergency medical services (EMS)...

Co-written by Scott A

Co-written by Scott A. Moore, Esq., Principal, Moore EMS Consulting LLC
“Healthcare providers should examine the entire lifecycle…each of these pieces is great individually, but the trick is getting them all to work together. That's when you get outstanding performance in your revenue cycle management." — Laura Holt, director of revenue cycle management of St. Luke's Hospital (Chesterfield, Mo.), Becker’s Healthcare Hospital CFO Report
(8 min read) This is the second blog in our emergency medical services (EMS) billing Key Performance Indicator (KPI) series. We’re taking a critical look at some of the more commonly used revenue cycle management (RCM) performance metrics for EMS agencies. Used in the proper context, these performance metrics can be an invaluable resource.
Oftentimes, when we use the term KPI with ambulance billing service employees, eyes roll or glaze over. Understandably, these professionals are tired of taking the blame for the austere reimbursement environment in which many EMS agencies operate. Truthfully, we are not fans of the term Key Performance Indicators either. We prefer to use the term Financial Vital Signs.

As someone who got his start in the EMS industry as a healthcare provider (now an attorney), this article’s co author, Scott Moore, can intuitively embrace the significance of vital signs. They not only provide a clear representation of the patient’s condition, but also an indication of how the provider’s knowledge and skills can be used to help the patient. Even a non-healthcare practitioner like co-author and career attorney, Brian Werfel, can understand the concept of vital signs. When discussing RCM metrics, we frequently refer to them as RCM vital signs. We do this because, like patient vital signs, any one sign can be important; however, more often, multiple vital signs are necessary to truly understand a patient’s condition. Similarly, an organization’s combined RCM vital signs provide the clearest indication of financial health and viability.
In Part 1 of this series, we tackled Billing Lag Time — the inherent lag time between the date of an ambulance transport and the date the claim is submitted to the applicable payer. We believe that too many in our industry view the shortest possible Billing Lag Time as the ultimate goal. It has a certain appeal; after all, the sooner a claim is submitted to the payer, the sooner it will translate into revenue for your organization.
A narrow focus on shortening Billing Lag Time misses the larger point, which is that there is an optimal time to submit every claim. That may be as soon as possible, but not always. For example, early in the calendar year, patients may have unmet deductibles. Submitting a claim before that deductible has been met requires attempting to collect that deductible from the patient. Therefore, we argue that Billing Lag Time is useful as a measure of how quickly your billing office could get a claim out the door, but not whether the claim should be billed right away.

Billing Lag Time can alert you to potential problems in your RCM process and can significantly impact DSO or Days in Account Receivable (Days in AR).
DSO is typically a measurement of the average number of days it takes your organization to be paid for ambulance service claims. Therefore, it makes sense that your organization should aim for the shortest DSO. A shorter DSO represents a more efficient, effective RCM process.
DSO can be calculated in multiple ways. You should be consistent both in the calculation and the time (date) of the calculation. The basic formula is:
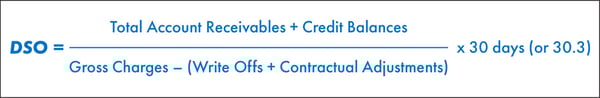
We recommend that DSO be measured using a 90-day rolling average. This helps smooth out any seasonal fluctuations. We know that EMS can be a difficult claims collection environment. Most EMS organizations we work with target a DSO of 40-50 days.
An organization’s target DSO is significant; however, we would argue that the actual number of days is less important than DSO volatility, (the increase or decrease in DSO over time). In other words, DSO should be viewed as a relativistic performance metric.
To see why the actual DSO matters little to an EMS organization’s overall financial health, consider a comparison of two similar EMS entities that both commenced operations on January 1, 2020. These two entities operate in the same geographic area, provide the same number of responses and ambulance transports, have the same payer mix, etc. Both companies use cash-based accounting and only recognize revenue when it is actually received from the payer or patient. For the sake of this illustration, we will assume that both companies have a Billing Lag Time of 0 days and submit claims on the same day they provide the ambulance transport. The only difference between these two organizations is that the first company (Company A) has a DSO of 30 days, while the second company (Company B) has a DSO of 365 days.
In their first year of operations, both companies provided a total of 1,200 ambulance transports, an average of 100 transports per month. On December 31, 2020, Company A will have submitted claims and been paid for 1,100 of these ambulance transports. Company A will have submitted an additional 100 claims that yet to be paid. If we assume an average payment of $100 per claim, Company A will have booked $110,000 in revenue for calendar year 2020. By contrast, Company B will have submitted the same 1,200 claims. Owing to its longer DSO, however, it will not have been paid for any of these claims. Thus, Company B will have booked no revenue for calendar year 2020.
If we end our comparison on December 31, 2020, it is clear that a lower DSO is preferable. Let’s examine what happens if we extend our comparison for another year.
By the end of calendar 2021, Company A will have submitted another 1,200 claims, and received another $110,000 in revenue. It will also receive $10,000 for the claims submitted in the final month of 2020. Thus, Company A’s total revenue for calendar year 2021 will be $120,000. Company B will have submitted another 1,200 claims, none of which will be paid by the end of calendar year 2021. However, it will start to receive payments on the claims it submitted in 2020. All told, it will be paid for the same 1,200 claims, and book the same $120,000 in revenues as Company A.
This comparison illustrates that as long as DSO remains constant, an EMS organization’s total revenues will normalize after an initial period. This is why we maintain that the change in DSO over time is far more important than the actual number of days represented by that DSO.

We recommend that your billing department implement policies to track the changes in DSO over time. This entails capturing a baseline DSO, and then measuring at periodic intervals according to a pre-determined schedule. We recommend measuring DSO using a 90-day (or longer) rolling average in order to smooth out certain expected, seasonal fluctuations.
As with all RCM vital signs, the results should be documented and tracked. This will help you identify subtle changes or trends that could be symptoms of larger issues in your RCM process. Maintaining an RCM vital sign log or dashboard will permit you to spot and respond quickly to changes and prevent negative outcomes.
It is also important to understand that there will be times when your DSO may stretch. This is not necessarily a bad thing; moreover, occasional changes may be the result of factors that are outside of your control. For example, patient deductibles typically reset in January. If you elect to extend your Billing Lag Time to reduce the likelihood of getting hit with the patient’s deductible, that decision will increase DSO. By contrast, continuing to push invoices out the door in January to keep DSO short might have the unintended effect of lengthening it. The key is to understand why the KPI has changed and adjust the billing process to optimize revenue for your organization.
RCM vital signs are relational: one vital sign tends to affect another. Pushing your claims out the door too quickly may increase your bad debt and overall collection percentage. The goal is to know the seasonal impacts on your organization’s RCM vital signs, and to adjust your RCM processes accordingly.
In the coming months, we’ll take a critical look at some of the other more common KPIs used by our industry. Next up is accounts receivable over 90 days. Drop an email to Brian Werfel at bwerfel@aol.com if there are any that you’d especially like to see discussed. Want to receive the ZOLL Pulse Blog in your inbox? Subscribe.
Are Your Key Performance Indicators Costing You Money? (Part 1)
Are you Key Performance Indicators Costing You Money? (Part 3)
How ePCR Data Influences Clinical, Operational, and Financial Outcomes
How To Cut EMS Patient Collection Time With Digital-first Billing and Payment
Subscribe to our blog and receive quality content that makes your job as an EMS & fire, hospital, or AR professional easier.
Subscribe to our blog and receive quality content that makes your job as an EMS, fire, hospital, or AR professional easier.