News Alert: New ePCR Integration Simplifies EMS Data Management and Enables Better Care Coordination
Level-up Your ePCR Data Collection and Implementation
Earlier this year, ZOLL hosted a webinar on Operationalizing Data

Earlier this year, ZOLL hosted a webinar on Operationalizing Data. After the webinar, we asked attendees to share what, if anything, their organizations were doing to track KPIs, manage their data, and transform it into actionable insights. Over 300 EMS professionals from across the United States responded, and the results surprised us!
Respondents indicated that the top concerns at their organization included clinical outcomes, clinical metrics, and compliance. However, only 43% of organizations indicated that they’re currently tracking metrics. These results made it very clear that for many EMS organizations, clinical data and compliance are the areas for biggest improvement.
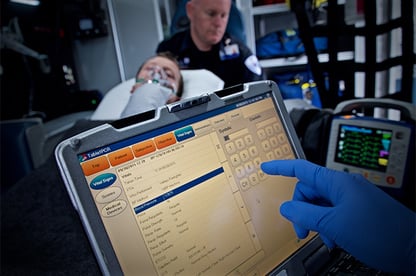
Given this, we asked Ben Barnett, Product Owner for RescueNet ePCR,to weigh in on how agencies can improve their data and reporting capabilities. Ben and his team work directly with medics to define and build products that simplify charting for EMS encounters. This direct contact with customers has given him a wealth of insight when it comes to many EMS organization’s challenges with collecting, managing and analyzing ePCR data.

What are some best practices for collecting and analyzing data?
Agencies should start by focusing on high-quality data collection, as this leads to improvements in patient care and often increases revenue because better data results in fewer denied claims. Staying in touch with your crews to make sure they have the data they need is important. Are they documenting generic list values because specific ones don’t exist? Can certain fields be moved in the user interface to help clarify what is being asked? Do business rules need to be tweaked so the important things are being collected based on call type? These are questions that should be asked regularly to help with more effective data collection.
Another practice I see often overlooked is the quality assurance/quality improvement (QA/QI) process. Rather than just asking crews how documentation is going, take a look at the actual data. Setup a process where you’re reviewing PCRs on at least a monthly basis. A good QA/QI process typically will be used to verify correct protocols are being followed on specific types of calls (Cardiac, STEMI, etc.) which ensures the highest level of care is being provided to patients on those critical calls. But an added value to this process is it allows you to also review how crews are documenting. Are there certain fields that never get documented? Why? No matter what size of organization you are, or type of software you’re using, QA/QI helps you keep your fingers on the pulse of how the crews are documenting and identifies areas where your crew may need more education.
For those people who have complex patient charting systems that keep them from being as productive as they could be, do you have advice on how to “uncomplicate” your system?
Similar to helping with better data collection, it’s important to keep your charting system easy to understand. Sometimes more data isn’t always better. When you look at your patient charting application what do you NEED to collect verses what you WANT to collect? How often do you go through the different pick lists, protocols and reports in your system to see what is in there that can now be removed? Can you configure defaults, templates and other time-savers to make it faster for your crews to document? On many occasions less is more: by being more deliberate with what you need and removing things that are not necessary, the end result is a less complicated system.

Most organizations are tracking at least a few categories of EMS metrics. Once you have the data – what do you do with it?
Benchmarking can help you figure out where you are as an organization and how you compare with others. Did you know that you can access the data that the state collects from the EMS agencies? This is the data that you and other agencies are sending to your state now. So, if you wanted to see how your response times compared to others in the state, you just have to ask. No need to share what your results are with anyone else if you don’t want to, but take advantage of the data available to you to decide where your agency can improve. Most states can give you de-identified reports and/or data so you can see how you compare to the other agencies in the state.
Once you have the data – what do you do with it? How can you measure the strengths and weaknesses of your organization against others?
- Make sure you understand your own data and how you’re performing.
- Develop key performance indicators (KPIs) to track the metrics that you care about.
- Identify areas where you can improve.
- Understand how you’re performing in these areas today and define targets for how you’d like to perform in the future.
- Compare your performance against other agencies like yours.
- Optimize your software and streamline your process to make your data as accurate as possible.
- Then, make a plan for creating change – testing one variable at a time!
- Finally, inspect, adapt and iterate often. Get into the habit of analyzing your data and changing your protocols to get to the goals you’re seeking.
Do you use Insight Analytics for RescueNet ePCR? You should if you’re not. It’s a great way to get analytics on your data, including intubation frequency by medic. Looking at how often each medic has the opportunity to intubate a patient will help determine who needs a refresher.
Okay so you’re tracking these metrics – what next?
- Test multiple variables to see which one really shifts the needle.
- Tie your data goals into business objectives and decide which are most important – focus on what you really want to improve.
- Use your data and collected metrics to identify training opportunities for your crews.
Take CPR metrics as an example. With Case Review, you’re able to see how well each of the medics are doing with their CPR and can even provide a CPR report card for them to help show them how they’re doing. Metrics with CPR on speed and depth are critical in life-saving situations, and using these metrics to help others see how they are performing can improve patient outcomes.
Knowing that over half of our respondents listed clinical outcomes as their biggest area of concern, how can you do a better job of tracking and managing these outcomes?
Establish a relationship with the main hospitals you transport to, and start gathering outcomes data on important call types (i.e. Cardiac, STEMI, Stroke). It’s always good to see if the protocols and procedures your crews provide are making a difference with outcomes. ZOLL is currently developing solutions to help our ePCR customers with this … more to come soon!
Want more information? To watch the webinar, click here:
Further reading:
https://www.zolldata.com/blog/get-better-at-collecting-analyzing-and-actioning-your-ems-data-in-2019
https://www.zolldata.com/blog/why-your-ems-agency-should-be-tracking-financial-operational-metrics
https://www.zolldata.com/blog/the-most-important-metrics-your-agency-should-be-measuring
https://www.zolldata.com/blog/track-these-7-kpis-to-improve-ems-billing-efficiency
Related Posts
How STAT MedEvac Connected Device, Software, and Data Technology To Enhance QA and Elevate Care
Podcast: 4 Ways ePCR Software Can Relieve EMS’ Biggest Headaches
ZOLL Pulse Blog
Subscribe to our blog and receive quality content that makes your job as an EMS & fire, hospital, or AR professional easier.
ZOLL Pulse Blog
Subscribe to our blog and receive quality content that makes your job as an EMS, fire, hospital, or AR professional easier.


