Doing More With Less: How Dispatch Automation Benefits EMS Operations
The personnel shortages in the emergency services don’t spare public safety answering points (PSAPs) and call centers; telecommunicators,...

Crunching data to find the nugget of information you need to make a decision can be challenging, especially if the data set you are looking at has millions of records of data, or more
Crunching data to find the nugget of information you need to make a decision can be challenging, especially if the data set you are looking at has millions of records of data, or more. Boiling that data down into the right summary table, chart or map takes time. It also requires that you have an idea of what you need to see.
Road Safety captures millions of records a day. As Road Safety captures information about the behavior of the driver, it will immediately use that data to provide in-vehicle feedback to the driver to let them know they are outside the boundaries of safe driving. The driver can then correct their action(s) to return to safe behavior. The Road Safety 4000 in-vehicle box also sends the collected data up to ZOLL Online for further analysis. Road Safety customers can then view the detailed or aggregated data using a number of pre-built reports and dashboards or by building their own custom report.
To aid in this analysis of driver safety data, the Road Safety product team recently released a new report to ZOLL Online called the Run Analysis Report. It’s currently in BETA form as we gather feedback from our customers, but is available to all customers using ZOLL Online to review Road Safety data. The Run Analysis Report enables viewing and analyzing individual runs on a map. This geographic intelligence is in addition to our traditional second-by-second report, which is also included in the Run Analysis Report.
How the Report Enhances Road Safety
We built the new report to better show how a vehicle is driven over the course of a full run. Road Safety has numerous reports that summarize total violations and tell you how many risky “things” a driver, or group of drivers, is doing. The map shows you where they are occurring. Often times, it takes a matter of seconds for the person viewing the map to recognize the location and relate to what they are seeing personally – having likely driven those same locations many times themselves. The one doing the analysis will see a pattern across various drivers and “hot spot” locations can be watched and/or discussed.
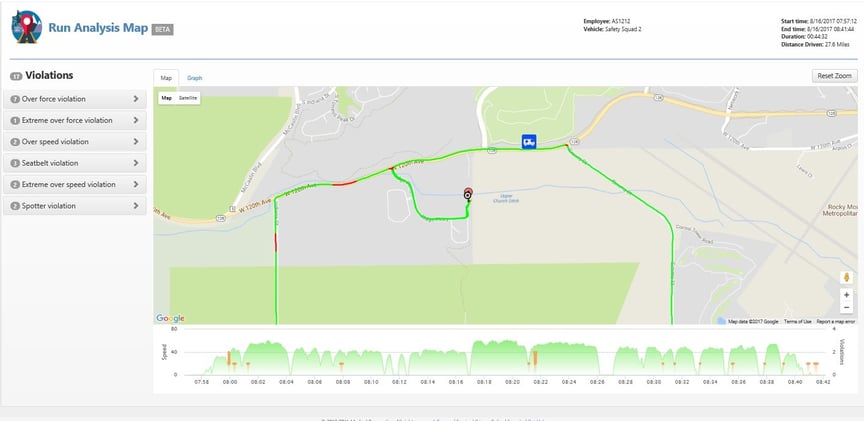
In this report example, the primary area on display shows the run on a map. A listing of the various violations is included on the left and a high level timeline below the map. The map and the timeline are linked. As you highlight a specific piece of the timeline, the map will zoom to that part of the run:

The existing second-by-second graph is also included within the Run Analysis Report and can be displayed by selecting the graph tab (instead of the default Map tab). The second-by-second chart allows a deep dive into the data and lets you see how specific data points (RPM, braking, acceleration, G-Force, etc.) relate to each other.

The combination of the geographic intelligence from the map and the second-by-second tool allow you to more easily dig into a problem and begin assessing what solutions are possible and what changes need to be made. Having it all in one place means you won’t have to bounce between reports to complete your analysis.
The Run Analysis Report can be accessed directly from the existing Run Report. When in the Run Report, click the road icon, as shown in the below example:

Already Using the Run Analysis Report? We Want to Hear From You
As mentioned earlier, this is the first release of the Run Analysis Report, and we are on the tail end of the Beta process. We are responding to feedback from customers and are listening to their ideas for future features. The long-term vision for the tool is to incorporate more data, such as the identification of any potential impacts to vehicles or speed details, and to further leverage the power of geographic information systems (GIS) to deliver high value intelligence to aid you in growing your safety culture.
Helping you solve the driver-safety problems you face each day is our top priority. The Road Safety team is excited about this new report. We have had great feedback so far and encourage all Road Safety users to reach out and let us know what you think.
Doing More With Less: How Dispatch Automation Benefits EMS Operations
How EMS Technology Integration Can Have Compounding Value for Agencies
4 Must-have Data Points for Dispatch-Billing Alignment and Maximum Reimbursement
Subscribe to our blog and receive quality content that makes your job as an EMS & fire, hospital, or AR professional easier.
Subscribe to our blog and receive quality content that makes your job as an EMS, fire, hospital, or AR professional easier.